
Router Status
This page provides information about the properties of added routers. You can also find out more about Wi-Fi clients, Wi-Fi links and Wi-Fi status.
Routers
 This bookmark gives you an overview of routers in the system.
Displayed information is subject to an active router interface.
| |
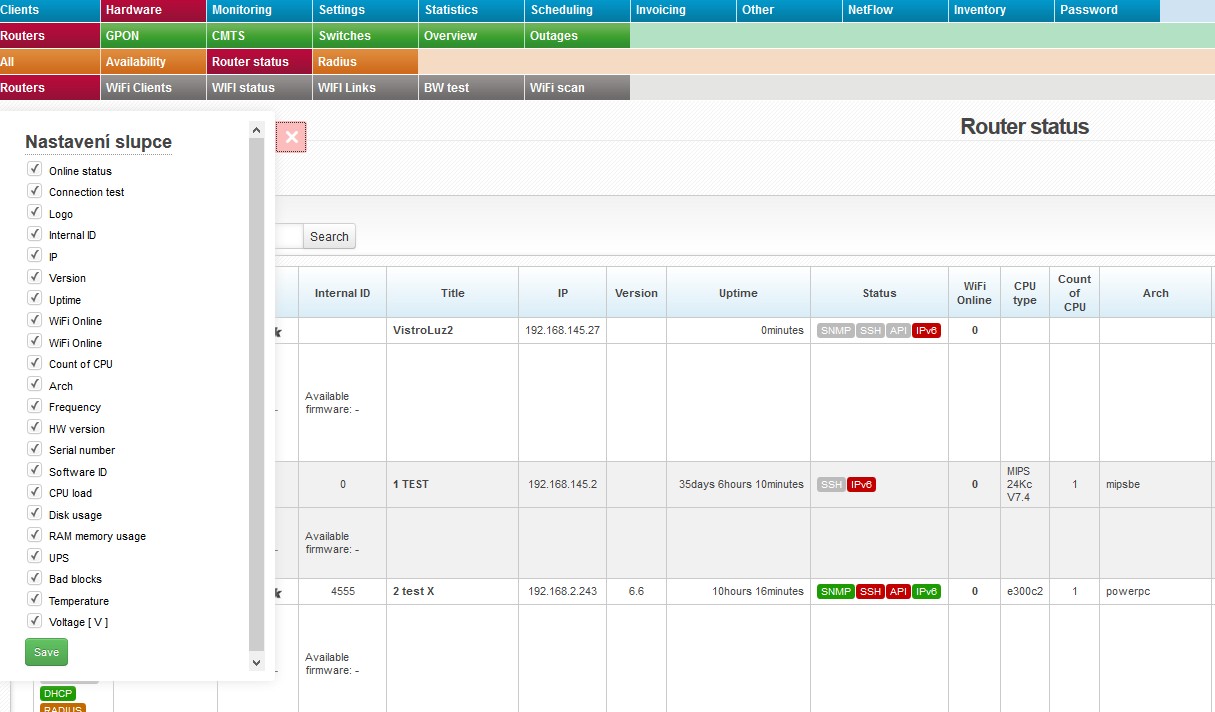
Click on this icon to open a menu, in which you can check columns to be displayed (Table settings), columns to be printed (Print settings), and Search settings. Then press Save and
All entries can be sorted by every displayed column. Click on column name to display the list by the requested column. Click once to sort in ascending order, twice for descending order. |
| Extended statement | It will display router identity - its name from Winbox, not ISPadmin. The following icons are also displayed: FIREWALL, DHCP, MACFILTER, WLAN FILTER, and RADIUS. Inactive settings is highlighted in grey, e.g. FIREWALL. It also displays information about Current/Available firmware. |
Columns
| Online status | ■ online |
|---|---|
| It will test connection to router and connected devices (Ping test, SNMP test, SSH test, API test). | |
| Title | Click on the name to display router in Hardware Routers All, where you can also edit it. |
| IP | IP address of device |
| Version | OS version of the installed system |
| Uptime | Uptime from the last reboot |
| Status | Status of the following services: SNMP, SSH, API, and IPv6. Active service is in green, e.g. SNMP. |
| WiFi Online | Number of connected WIFI clients; click on it to display a list of WIFI clients. |
| Arch | Processor architecture |
| Frequency | Processor frequency |
| Serial number | Routerboard serial number |
| Software ID | MikroTik license ID |
| CPU load/Disk usage/RAM memory usage | Click on % to display daily/weekly/monthly/yearly graphs. |
| UPC/Voltage | If there is a UPS device connected to MikroTik router (driver is installed correctly) and UPS is recognized, so the system is able to monitor UPS voltage and send notification e-mail in case of power outage. If UPS is connected, the column Voltage shows a current UPS voltage. Click on the voltage value to display a detailed graph. In case of power outage, the system sends an email defined in Settings System Settings General, ID admin_email. |
| Bad blocks | Number of error blocks of flash memory for MikroTik routers |
| Temperature | Routerboard temperature (valid for some MikroTik routers only) - click on the value to display graphs. |
WiFi Clients
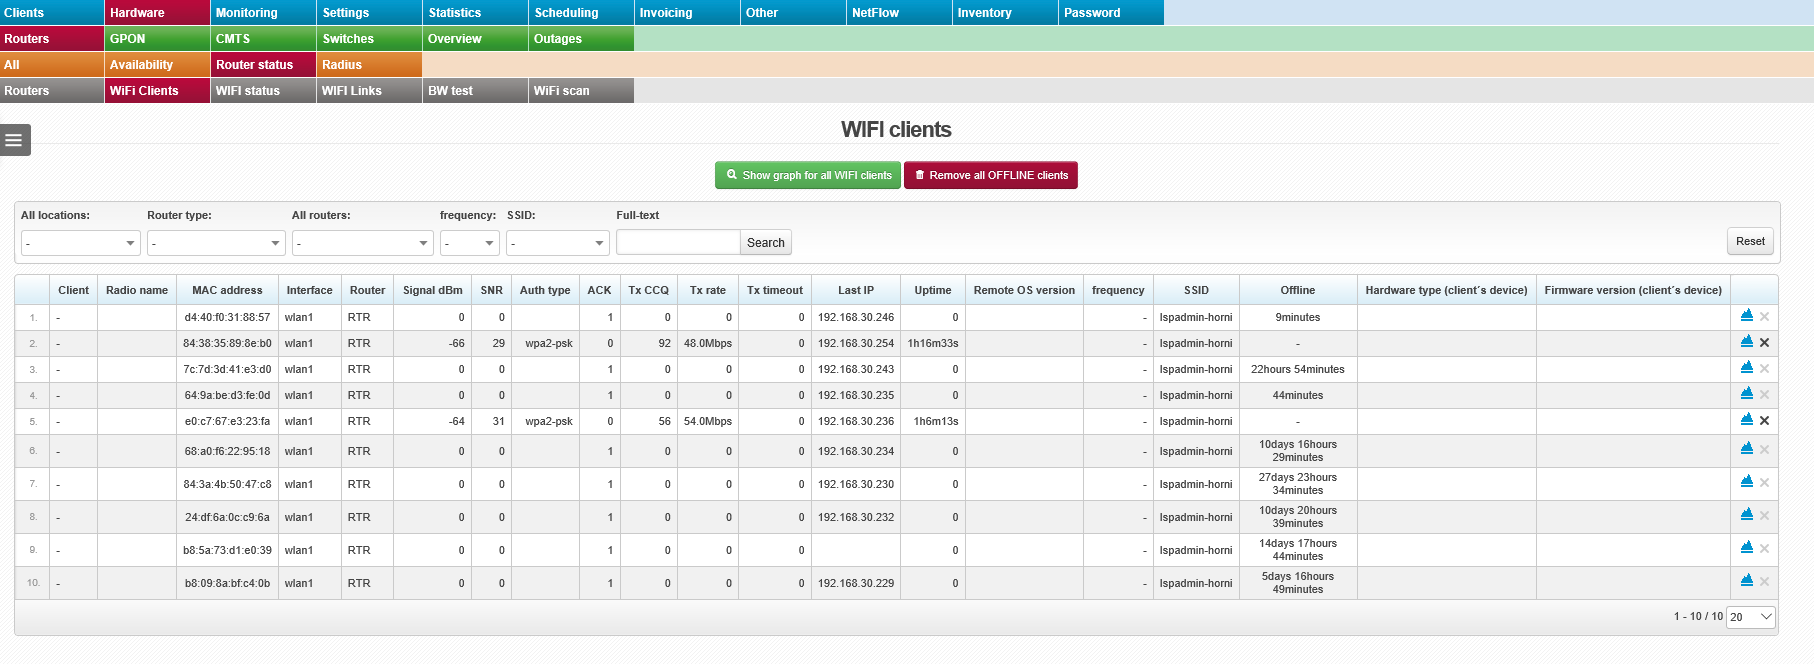
This is a list of all clients connected to routers. You can filter the list by Location, Router type, Router name, Frequency, SSID, and using fulltext search.
| |
Click on this icon to open a menu, in which you can check columns to be displayed (Table settings), columns to be printed (Print settings), and Search settings. Then press Save and
All entries can be sorted by every displayed column. Click on column name to display the list by the requested column. Click once to sort in ascending order, twice for descending order. |
| Show graph for all WIFI clients | It will display graphs for all WIFI clients on a router. Displayed daily graphs are listed on one page. Click on a daily graph to display daily, weekly, monthly, and yearly graph. |
| Remove all OFFLINE clients |
A dynamically loaded table of clients on AP will be deleted. The table will be re-loaded every 5 minutes automatically. Usage: e.g. situations when a client´s MAC address is changed, and dynamic table still contains old information. |
Columns
Connection info is diplayed for each WIFI client, such as Signal dBm, Tx CCQ, Uptime etc. Click on ![]() to display this information in a graph. You can determine trends, e.g. for ACK, Signal, Noise, and Tx CCQ (approximate value of a line in %). So these are online values, thanks to which can you react quickly and identify problems with client devices.
to display this information in a graph. You can determine trends, e.g. for ACK, Signal, Noise, and Tx CCQ (approximate value of a line in %). So these are online values, thanks to which can you react quickly and identify problems with client devices.
Click on client name to open Client card.
WiFi Status
Details of wireless interfaces are retrieved from all routers. Utilization of the Wi-Fi bands used is displayed in graphical form.
This page contains a list of routers along with their wireless interfaces. Available details: SSID, frequency, band used, etc.
Records can be filtered using the Locality, Router and Band pop-up menus. You may also perform a fulltext search on the list (Fulltext). The configuration of this page is automatically saved to the system. When you log in next time, it remains unchanged.
When you click on the name of a particular interface, utilization of the Wi-Fi band used will be displayed in graphical form. In practice, it means that a graph will appear showing you the 5 GHz or 2.4 GHz band and the frequency of a given interface within it.
When you click on the GPS coordinates of a particular router, a map will appear with the router in question in its center (Google Maps).
Extended preview: show all interfaces and graphs illustrating frequencies used by wireless cards.
The interface row and the graph showing the frequency used are highlighted in red if the interface in question uses the same frequency as another interface or if the two frequencies partially overlap. Potential overlaps are searched for among all wireless interfaces on a given router and also among interfaces on different routers that are in the same place (the same GPS coordinates).
You can find out the following information in the graph:
- the frequency range that a given interface can use
- the currently used frequency
- the allocated band (depending on the set channel width)
- overlapping frequencies on individual interfaces that are on the same router or have the same GPS coordinates
- the forbidden frequency range in 5 GHz links (5.315 GHz - 5.550 GHz) - the section without the grey background
- when you hover over the name of a particular interface, all details of this wireless interface will appear. The same details will also appear when you hover over the name of an interface in the Routers tab. You may also see here information about installed antennas (including details of the type used, gain, beamwidth, etc.).
- In the Internet statistics section of the Client card, you can find the following information about a client’s Wi-Fi card: SSID, the interface to which a given client is connected, SNR, uptime ...
BW Test
The bandwidth test measures transfer speeds between two MikroTik routers. You can choose whether you want to test only the download direction or only the upload direction or both. You may also select the protocol used for this test. Connectionless UDP (the speed measured is higher) or connection-oriented TCP (the speed measured is lower).
Individual tests can be scheduled in advance or run at regular intervals. For example, when traffic is expected to be particularly heavy.
+ Add new BW test
- Name - Enter any name.
- Test duration - It can have any value between 5 and 60 seconds.
- Source router - Choose the source MikroTik router.
- Destination router - Choose the destination MikroTik router.
- Destination extra IP address - The address of the interface through which a given test will be routed. Fill in the address only if you want it to be routed differently than through the default gateway.
- Run test - The date and time when a planned test will be carried out.
- Repeat test - If you intend to run the test repeatedly, choose the interval at which you want it to be repeated. If you check the Draw graph box and then modify the interval value, a warning will appear informing you that the graph in question will be generated anew. No data will be lost in the process. The only thing that will change will be the time period displayed (according to the set repetition interval).
- Test direction - Download, upload or both.
- Protocol - Choose one of the protocols offered. Connection-oriented TCP or connectionless UDP.
- Draw graf - Graphs are plotted only if you have already set the Repeat test parameter. If you have not set it, no graphs will be plotted.
Test results 
- Traffic graphs are displayed only if you have allowed it in the settings.
- The results of the last 500 tests are stored in the system.
- You can launch the test immediately by clicking on the Run test button. In that case, the test result will not be included in the graph.
- If an error occurs during the test, the text of the message is shown in the status column. Information in this column also specifies how the test was launched.
WiFi Links
This tab provides overview information about the properties of Wi-Fi links. You can see here realized links between MikroTik routers. The system automatically finds both ends of these links based on MAC address and SSID.
The following details are displayed in the overview: the names of routers (+ their IDs) on both ends of a link, SSID, frequency and SNR (signal strength) on both ends of a link.
By clicking on ![]() at the end of a particular row, you can view the traffic graph for the corresponding link and the signal strength graphs for both ends of this link.
at the end of a particular row, you can view the traffic graph for the corresponding link and the signal strength graphs for both ends of this link.
Graphs for all links may be displayed by checking the Display all graphs box, which can be found above the list.
Signal strength and traffic graphs for one end of a link are shown on the left-hand side of the page. Signal strength and traffic graphs for the other end of a link are shown on the right-hand side of the page.
WiFi Scan
The Wi-Fi scan allows you to scan the Wi-Fi band used on any MikroTik antenna. The system uses one of the functions of MikroTik routers to perform this test. At the end of the test, the system provides you with an overview of scanned devices and of the utilization of all available channels within a given Wi-Fi band.
+ Add new Test
- Name - The name used for this test.
- Source router - Choose the MikroTik router on which the scan is to be performed.
- WiFi interface - Choose the Wi-Fi card on this router.
- Run test - Run the Wi-Fi scan at a specified time.
- Repeat test - The Wi-Fi scan can be repeated at a specified interval.
- Test duration - It can have any value between 1 and 50 seconds. During the test, all clients are disconnected. Unless all channels are scanned, it is necessary to extend the duration of the test.
Displaying test results
Test results can be displayed in one of the following forms:
Utilization overview 
The percentage usage of the channels scanned is displayed here. Red color = highest values. Green color = lowest values. There is a overview of the results at the end of the table.
Test results
Data obtained from this test are used to create a tabular overview of individual frequencies and scanned devices (along with information about signal strength). If the test is run more than once, data are used to create a summarization of the utilization of individual channels. The most and least utilized channels are highlighted.
Test results can be displayed in one of the following three forms:
- By individual tests
- Average value over a specified period
- Average value over a specified number of tests
By individual tests
The left box contains links to the results of the last 12 tests. When you click on the date when a particular test was run, its test results will appear. They are rendered as a list of individual channels with their corresponding frequency, utilization and interference. When you click on Show retrieved AP, a list will appear of devices that were identified during a given test. You can find the following details in the list: interference, txPower, SNR, SSID, name and MAC.
Average value over a specified period
If the test has been launched repeatedly, you can view here the average values of the test results over the set period.
Average value over a specified number of tests
If the test has been launched repeatedly, you can view here the average values of the test results over the set number of tests.