
Dashboard
![]()
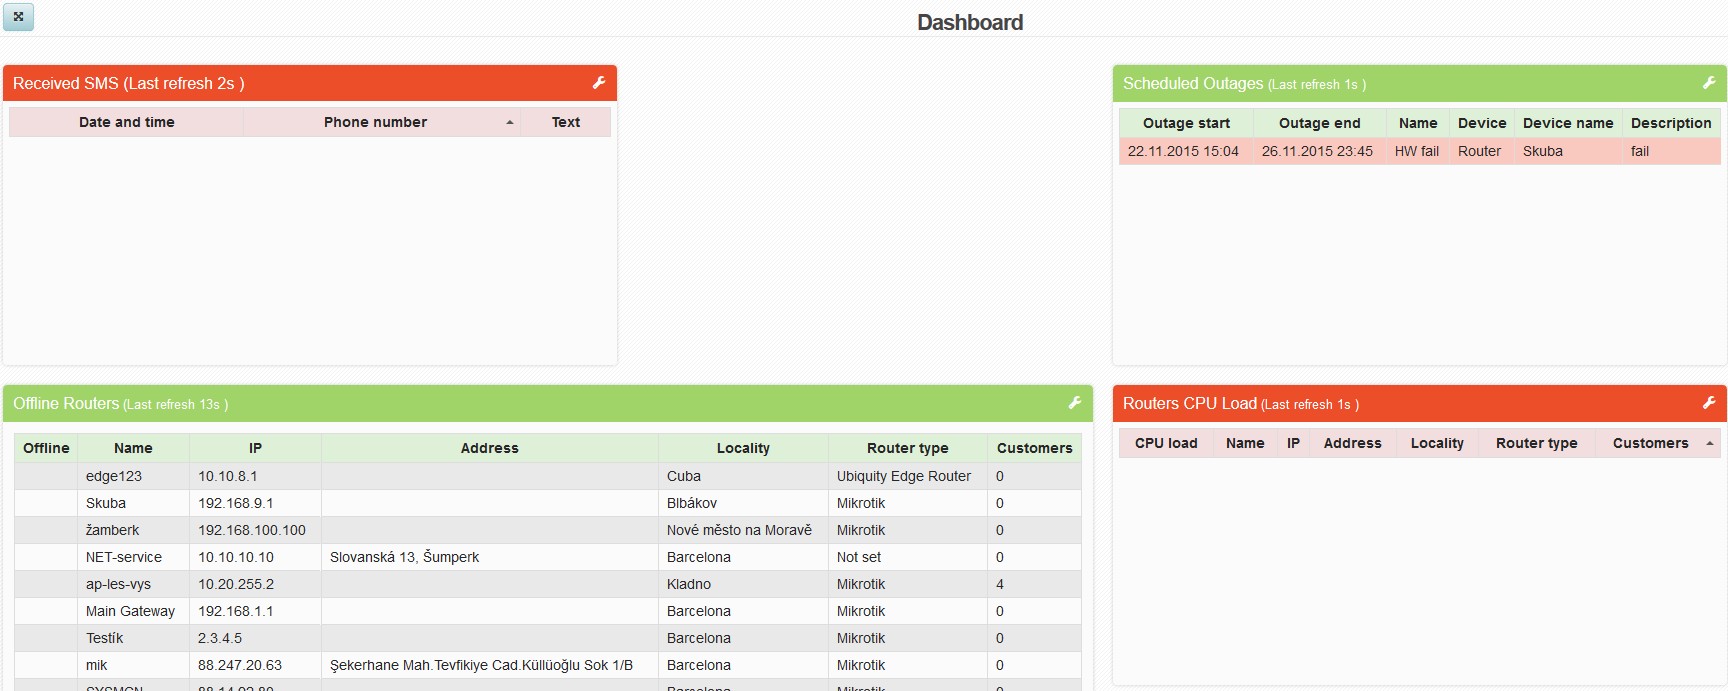
Dashboard was implemented in version 4.16 beta1. It enables you to see all important information from ISPadmin on one screen, e.g. TV set.
After you login to the system, a Dashboard icon is displayed in the upper toolbar, and opens Dashboard in a new window. It is recommended to use it on a separate screen where you start ISPadmin and open Dashboard with certain settings. In Settings Administrators Administrators, you can now enable/disable using Dashboard. Dashboard comprises of various panes, so called widgets. You can sort information in widgets by clicking column name.
| There is a full-screen button in the upper left corner. | |
| Widget display settings | |
| Settings of widgets is done for each widget individually and it is stored for currently logged administrator. You can set up layout, and update time for each widget. |
Currently implemented widgets
| Scheduled Outages | All scheduled outages are displayed, active ones are highlighted in red. |
| Routers CPU Load | Routers with higher CPU load are displayed here. You can set the CPU load value in widget settings. |
| Received SMS | All received SMS are displayed here; the same values as in Statistics History. You can set a number of days for displaying received SMS. |
| Off-line Routers | Off-line routers are displayed with off-line time. |
| Nagios notifications |
To display Nagios notifications in dashboard, you have to create a dashboard template in Settings Code lists Nagios Templates. Then you create a contact group with Dashboard in Settings Code lists Nagios Contacts. And finally, check a box in Report outages for Nagios section for monitored device in Hardware Routers, Edit, section Report outages for Nagios. |